A fast and calm way to see where your money goes so you can finally feel in control again
Most people do not track their spending because they think it needs fancy apps or confusing spreadsheets. The truth is much simpler. You can build a clean, easy dashboard in the next fifteen minutes that shows exactly where your money is going. No stress. No chaos. Just clarity you can actually use.
Think of this dashboard like turning on a light switch in a messy room. The mess does not magically disappear, but you can finally see where everything is. And once you can see, you know what to fix.
This is the same kind of dashboard people use to feel calm with their money instead of scared of their balance. You can create it today.
Why a Spending Dashboard Changes Everything
When your money feels out of control, it is usually not because you are “bad with money.”
It is because your money is happening in the dark.
A dashboard gives you a single view of your cash flow.
One place where:
• You see what came in
• You see what went out
• You see what is left
• You see which habits help you and which ones drain you
It is simple, but it is also powerful.
Clarity removes fear.
And fear is the main reason people avoid their finances.
Let’s Build Your Dashboard in 15 Minutes
Grab Google Sheets or Excel and follow these four steps. Keep it simple. You are creating clarity, not perfection.
Step 1: Create Three Main Columns
In a blank sheet, label three columns:
• Date
• Description
• Amount
This alone will catch everything that flows in and out.
Your dashboard starts here.
Step 2: Add a Category Column
Label a fourth column Category.
Use simple categories like:
• Groceries
• Eating out
• Transportation
• Personal care
• Bills
• Fun
• Savings
You do not need fifty categories. Too many labels creates confusion. Keep it light and clean.
Step 3: Add a Summary Section at the Top
At the very top of your sheet, create a small box that shows your totals:
Total Income
Total Spending
Total Savings
Top Spending Category
These numbers give you instant awareness.
It feels like checking your car dashboard while driving. You know your speed, your fuel, and your direction. Without that, you are guessing.
Use simple formulas:
• Sum income.
• Sum expenses.
• Highlight the category you spend the most in.
This takes two minutes and makes the whole thing feel real.
Step 4: Color Code Your Categories
Add a soft color to each category so your eyes can catch patterns fast.
For example:
Green for groceries.
Blue for bills.
Yellow for fun money.
Red for overspending.
Once you do this, your dashboard becomes a story. A visual story of how you spend and save.
This is why dashboards work. They take something overwhelming and turn it into something you can read in seconds.
In Less Than 15 Minutes, You Built a System Most People Never Create
Most people live their entire lives without knowing where their money goes. They guess. They hope. They panic when things get tight.
You are different now. You chose to understand.
And once you see the truth, change becomes easier.
This is how people build real financial confidence.
Not by being perfect.
Not by earning six figures.
But by finally understanding their own patterns.
Want a Ready Made Dashboard That Does All of This For You?
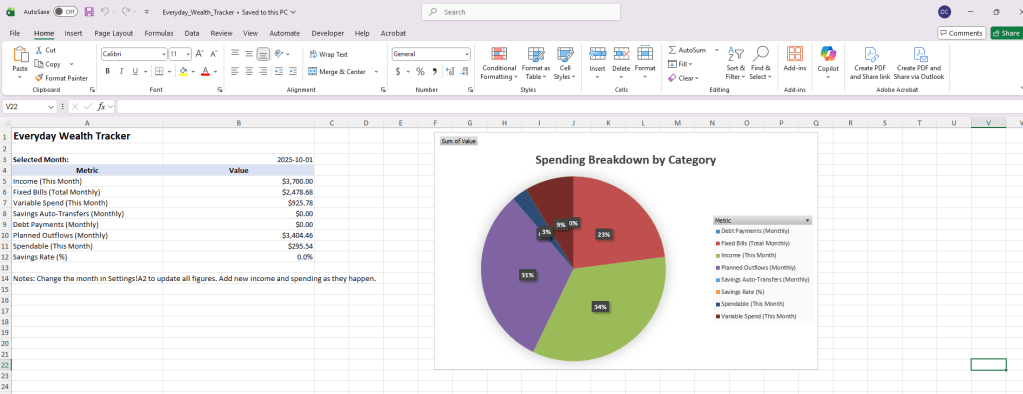
If you want a clean, easy dashboard that already has income tracking, spending summaries, color coding, and built in formulas, the Everyday Wealth Tracker can save you hours.
It is simple to use.
It gives you peace fast.
And it helps you feel in control of your money instead of guessing where it went.
If you want a tool that supports the habits you are building, you can get it here:

Leave a comment